Unified Analytics Platform
Background sync and incremental updates so many sources do not block dashboard load.
Unified ingestion pipeline and single analytics store with background sync. AI layer for trend summarization and anomaly explanation.
Product Overview
A closer look at the product surface, the business problem it solves, and the outcomes the system is designed to produce.
Unified Analytics Platform
Unified ingestion pipeline and single analytics store with background sync. AI layer for trend summarization and anomaly explanation.
Why this system exists
Business data spread across CRMs, marketing tools, and internal apps makes it hard to get a single view of KPIs. Manual reporting is slow and error-prone; ad-hoc exports do not scale as the number of sources or stakeholders grows.
Clarify the operating model
Background sync and incremental updates so many sources do not block dashboard load.
Reduce manual effort
Business data spread across CRMs, marketing tools, and internal apps makes it hard to get a single view of KPIs. Manual reporting...
Improve reporting visibility
Ingestion designed for 10+ sources and incremental runs to avoid full reloads on every sync.
Support scalable delivery
Visualization and summary layer built for many concurrent viewers and configurable date ranges.
Key Capabilities
The reusable template turns architecture tags into product capability cards so every domain communicates what the system actually does.
Ingestion
Single ingestion pipeline and normalized schema so all sources feed one analytics store.
Incremental sync
Background sync and incremental updates so ingestion does not block reads or dashboard responsiveness.
AI summaries
AI layer for trend summarization and anomaly explanation, with outputs treated as interpretative aids rather than system-of-record.
Observability hooks
Single ingestion pipeline and normalized schema so all sources feed one analytics store.
System Flow
A reusable process view showing how inputs become operational outcomes across AI, SaaS, analytics, healthcare, CRM, and internal tool projects.
Lead Sources
Ads, portals, websites, walk-ins, brokers, or user searches start the journey.
Qualification Layer
Single ingestion pipeline and normalized schema so all sources feed one analytics store.
Matching & Workflow
Background sync and incremental updates so ingestion does not block reads or dashboard responsiveness.
Operations Dashboard
AI layer for trend summarization and anomaly explanation, with outputs treated as interpretative aids rather than system-of-record.
Conversion Outcome
Background sync and incremental updates so many sources do not block dashboard load.
Architecture Overview
Layered cards make the system shape visible without exposing client-specific infrastructure or overfitting the page to one project type.
User Experience Layer
Dashboards, chat surfaces, and workflow screens provide a clear operating surface.
AI Layer
Model calls, scoring, summarization, or agent behavior are isolated behind defined interfaces.
Knowledge Layer
Domain context, embeddings, records, or normalized data provide grounding for decisions.
Workflow Layer
Queues, cron jobs, events, and rule-based actions run outside the critical path.
Analytics Layer
Reporting views make model output and operational status visible to teams.
Integration Layer
External sources and APIs connect through explicit sync or ingestion boundaries.
Scale & Production Considerations
Practical engineering concerns are promoted into scan-friendly cards instead of buried in long architecture notes.
Scalability
Ingestion designed for 10+ sources and incremental runs to avoid full reloads on every sync.
Performance
Heavy work is moved into background, cached, or incremental paths where possible.
Data Consistency
A unified model reduces drift between dashboards, lists, workflows, and reports.
Reliability
Visualization and summary layer built for many concurrent viewers and configurable date ranges.
Security
Access-sensitive workflows are designed around explicit routes, controlled surfaces, and future authorization boundaries.
Extensibility
Observability-ready structure (logging, metrics) around sync and AI calls for operational clarity.
Design Decisions & Trade-offs
A concise view of the implementation choices that shaped the product, the architecture, and the demo boundary.
Unified Data Model
Why: Unified schema required upfront modeling and some loss of source-specific nuance in exchange for consistency and simpler reporting.
AI Layer Separation
Why: AI summaries optimized for clarity and speed over maximum depth; heavy analysis stays in the data layer.
Tech Stack
The stack is always visible and grouped by role so technical reviewers can quickly understand the implementation surface.
Frontend
Database
AI
Product Logic
Related Systems
Other portfolio systems with overlapping domain, architecture, or implementation patterns to Unified Analytics Platform.
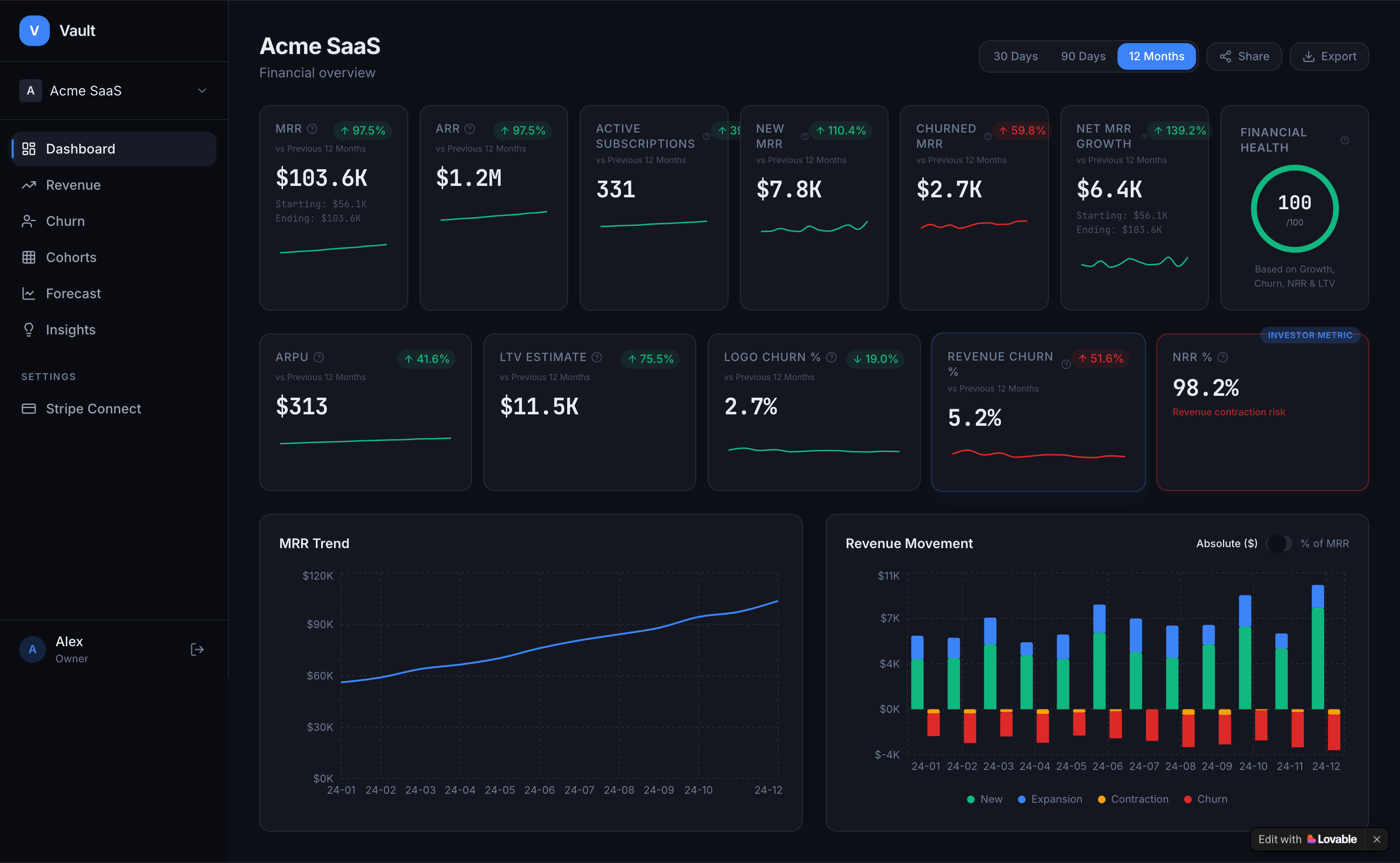
SaaS Financial Overview & Data Room
Single financial data model for MRR, ARR, movement, NRR, LTV, and health score. Date-range views and share/export for both operations and investors.
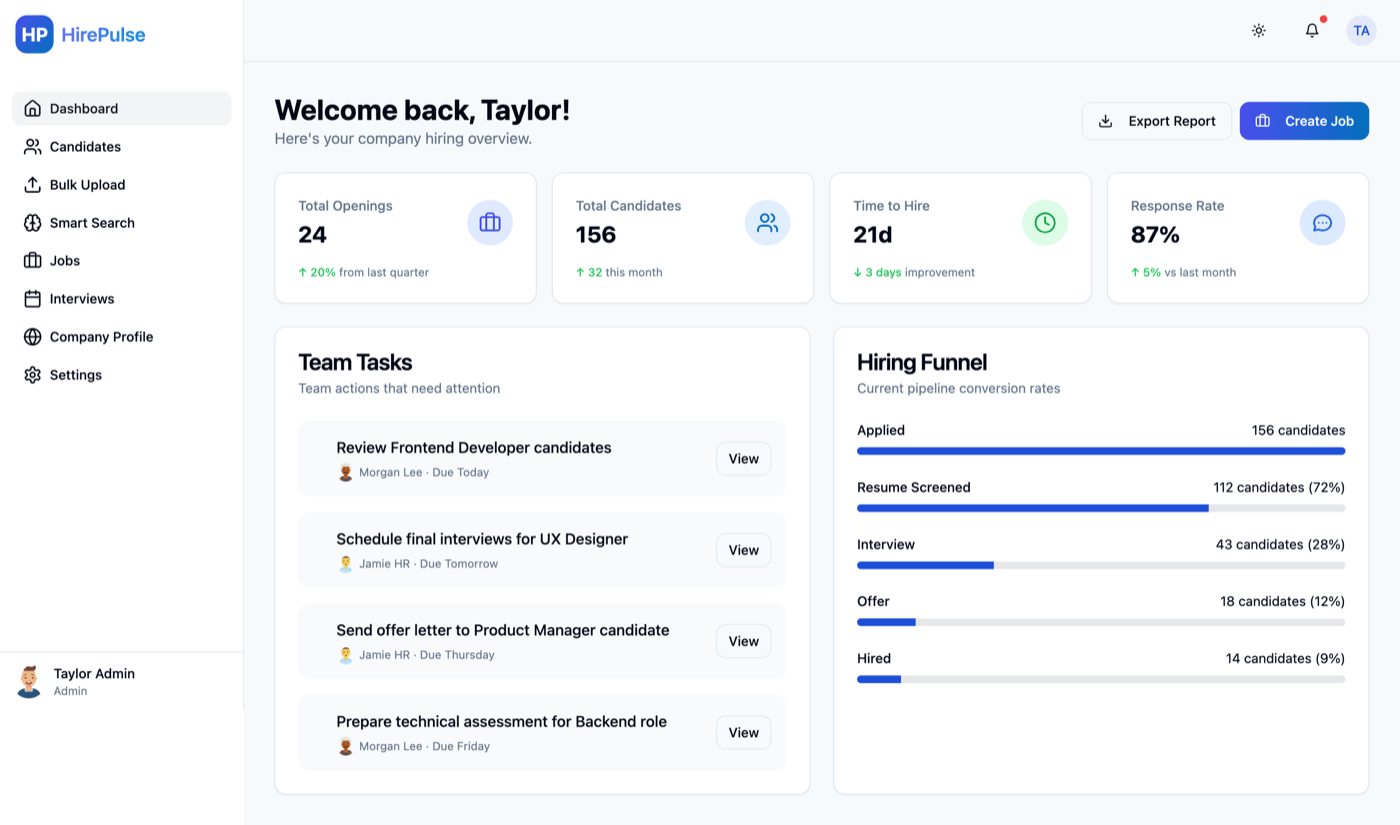
AI Hiring Assistant Platform
Modular AI pipeline with separated parsing, JD matching, and scoring layers. Async processing and queue-based ingestion for high-volume candidate flow.
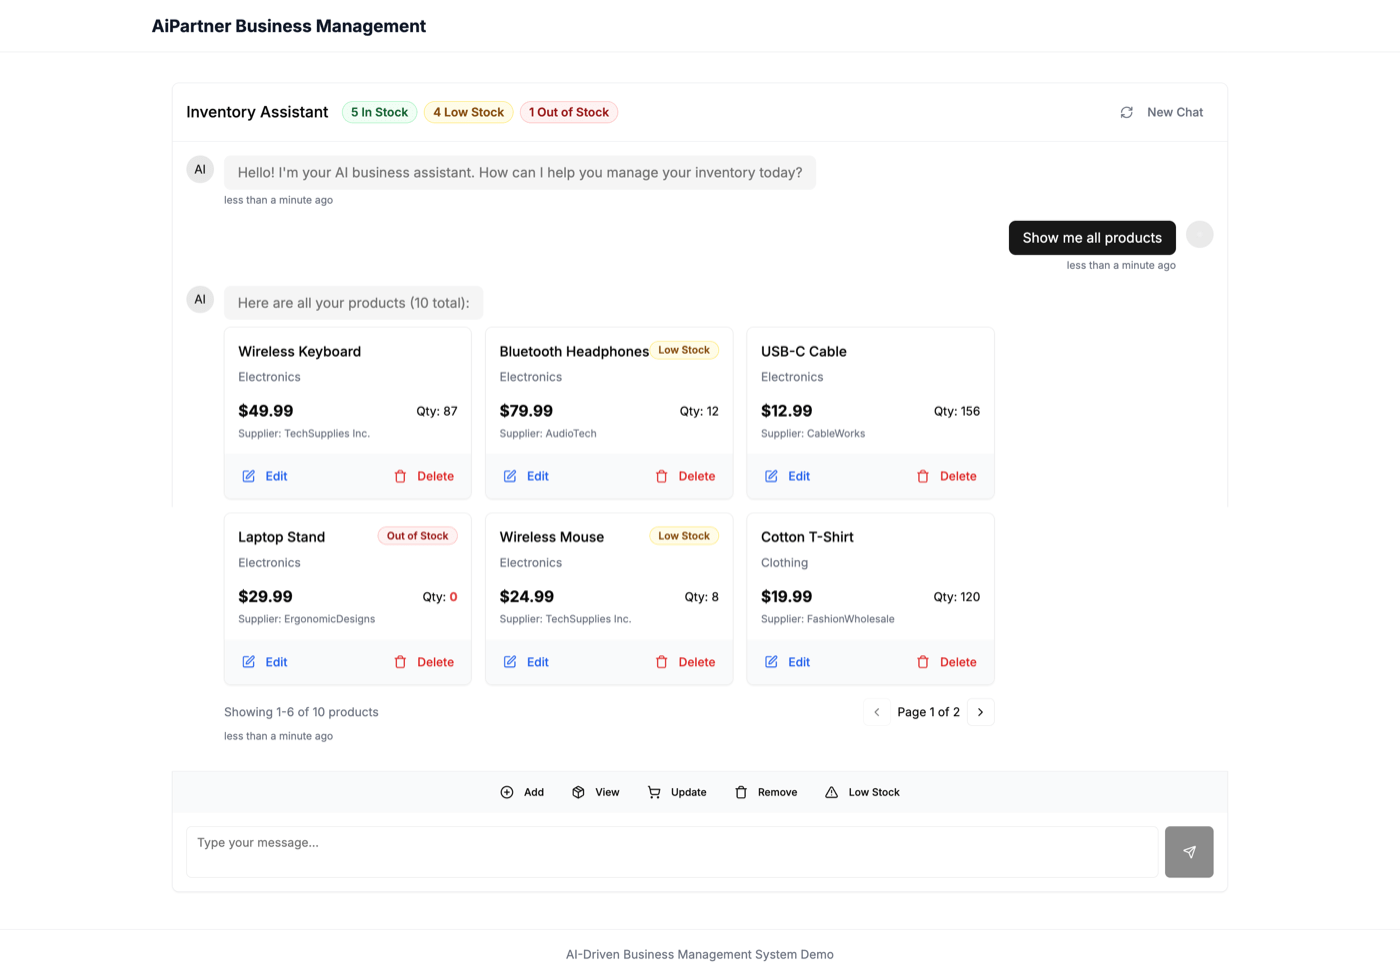
AI Partner Business Management
Centralized data layer with department-specific views and a single AI chat layer for cross-domain queries. Event-driven and cron-based automation.
Need a Similar System?
I design AI-native platforms, operational software, internal tools, workflow systems, and business applications.