SaaS Financial Overview & Data Room
Precomputed or cached metrics and configurable ranges so many viewers do not recompute on every load.
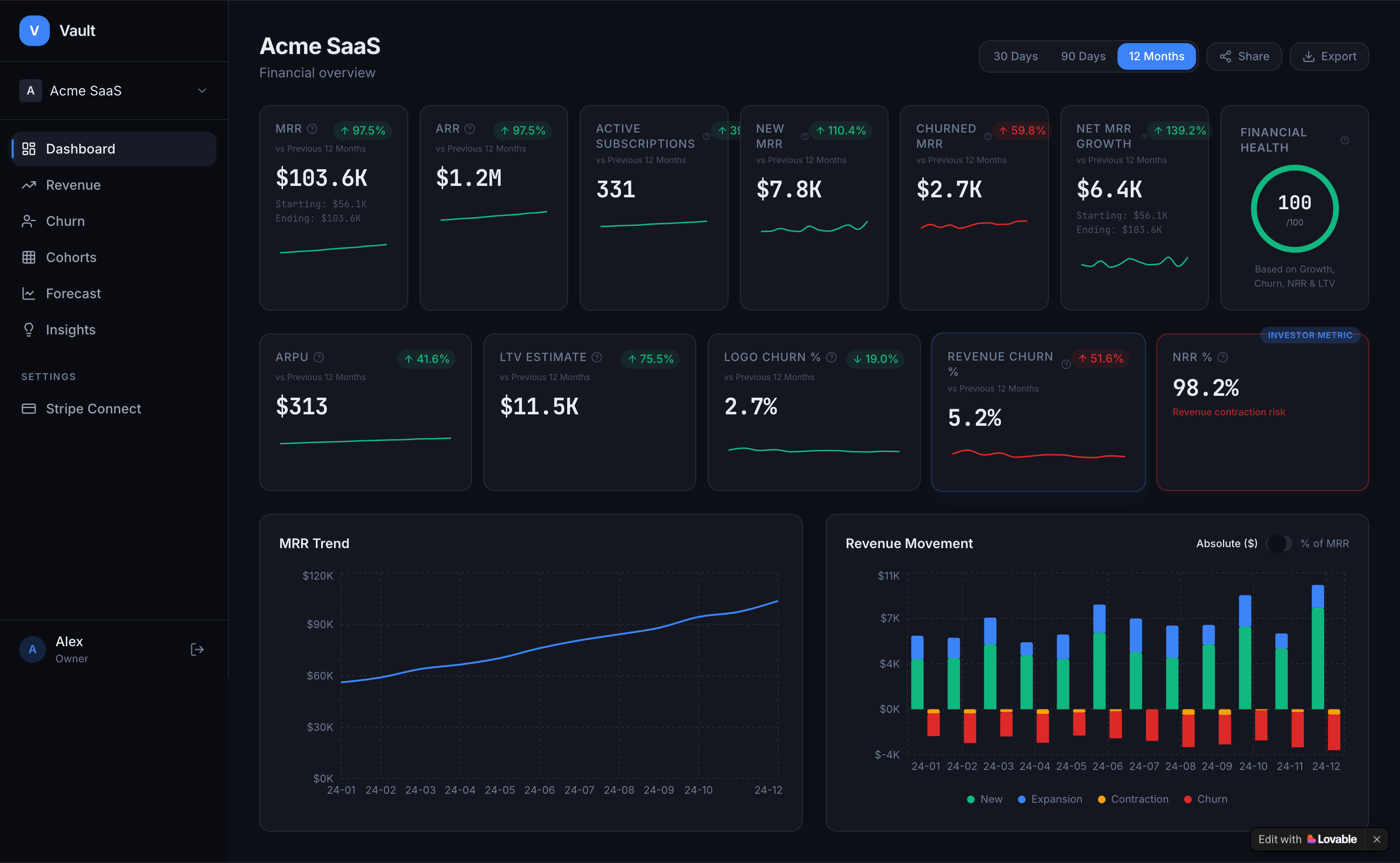
Single financial data model for MRR, ARR, movement, NRR, LTV, and health score. Date-range views and share/export for both operations and investors.
Product Overview
A closer look at the product surface, the business problem it solves, and the outcomes the system is designed to produce.
Why this system exists
SaaS financial metrics often live in spreadsheets and multiple tools. Leadership and investors need a single view; NRR, churn, and health scores are computed manually or in silos, which does not scale as data or stakeholders grow.
Centralize operations
Precomputed or cached metrics and configurable ranges so many viewers do not recompute on every load.
Reduce manual effort
SaaS financial metrics often live in spreadsheets and multiple tools. Leadership and investors need a single view; NRR, churn, and...
Improve reporting visibility
Dashboard and charts designed for configurable ranges and many viewers without recomputing on every request.
Support scalable delivery
Subscription and payment data (e.g. Stripe Connect) integrated so metrics stay current as volume grows.
Key Capabilities
The reusable template turns architecture tags into product capability cards so every domain communicates what the system actually does.
FinOps model
Single financial data model with MRR, ARR, movement, NRR, LTV, and health score derived from one source of truth.
Derived metrics
Date-range views and share/export so the same dashboard serves operations and investors without separate builds.
Investor-ready
Charts and tables built on precomputed or incrementally updated metrics where possible to keep load times predictable.
Export/share
Single financial data model with MRR, ARR, movement, NRR, LTV, and health score derived from one source of truth.
System Flow
A reusable process view showing how inputs become operational outcomes across AI, SaaS, analytics, healthcare, CRM, and internal tool projects.
Lead Sources
Ads, portals, websites, walk-ins, brokers, or user searches start the journey.
Qualification Layer
Single financial data model with MRR, ARR, movement, NRR, LTV, and health score derived from one source of truth.
Matching & Workflow
Date-range views and share/export so the same dashboard serves operations and investors without separate builds.
Operations Dashboard
Charts and tables built on precomputed or incrementally updated metrics where possible to keep load times predictable.
Conversion Outcome
Precomputed or cached metrics and configurable ranges so many viewers do not recompute on every load.
Architecture Overview
Layered cards make the system shape visible without exposing client-specific infrastructure or overfitting the page to one project type.
Source Layer
Business systems, spreadsheets, tools, or transactional inputs feed the platform.
Ingestion Layer
Sync jobs and normalization paths prepare data for reliable downstream reads.
Data Model Layer
A shared metric or domain model reduces duplicated business definitions.
Analytics Layer
Charts, tables, and summaries expose trends and exceptions.
Access Layer
Operators, leaders, and stakeholders consume the same governed view.
Scale & Production Considerations
Practical engineering concerns are promoted into scan-friendly cards instead of buried in long architecture notes.
Scalability
Dashboard and charts designed for configurable ranges and many viewers without recomputing on every request.
Performance
Heavy work is moved into background, cached, or incremental paths where possible.
Data Consistency
A unified model reduces drift between dashboards, lists, workflows, and reports.
Reliability
Subscription and payment data (e.g. Stripe Connect) integrated so metrics stay current as volume grows.
Security
Access-sensitive workflows are designed around explicit routes, controlled surfaces, and future authorization boundaries.
Extensibility
New modules, integrations, and domain-specific workflows can be added without changing the full system shape.
Design Decisions & Trade-offs
A concise view of the implementation choices that shaped the product, the architecture, and the demo boundary.
Unified Data Model
Why: Single data model and derived metrics required clear definitions and ownership; flexibility in ad-hoc analysis is traded for consistency.
Centralized Reporting
Why: Share/export optimized for standard views; highly custom report building is out of scope for v1.
Tech Stack
The stack is always visible and grouped by role so technical reviewers can quickly understand the implementation surface.
Frontend
Database
Product Logic
Related Systems
Other portfolio systems with overlapping domain, architecture, or implementation patterns to SaaS Financial Overview & Data Room.
Unified Analytics Platform
Unified ingestion pipeline and single analytics store with background sync. AI layer for trend summarization and anomaly explanation.
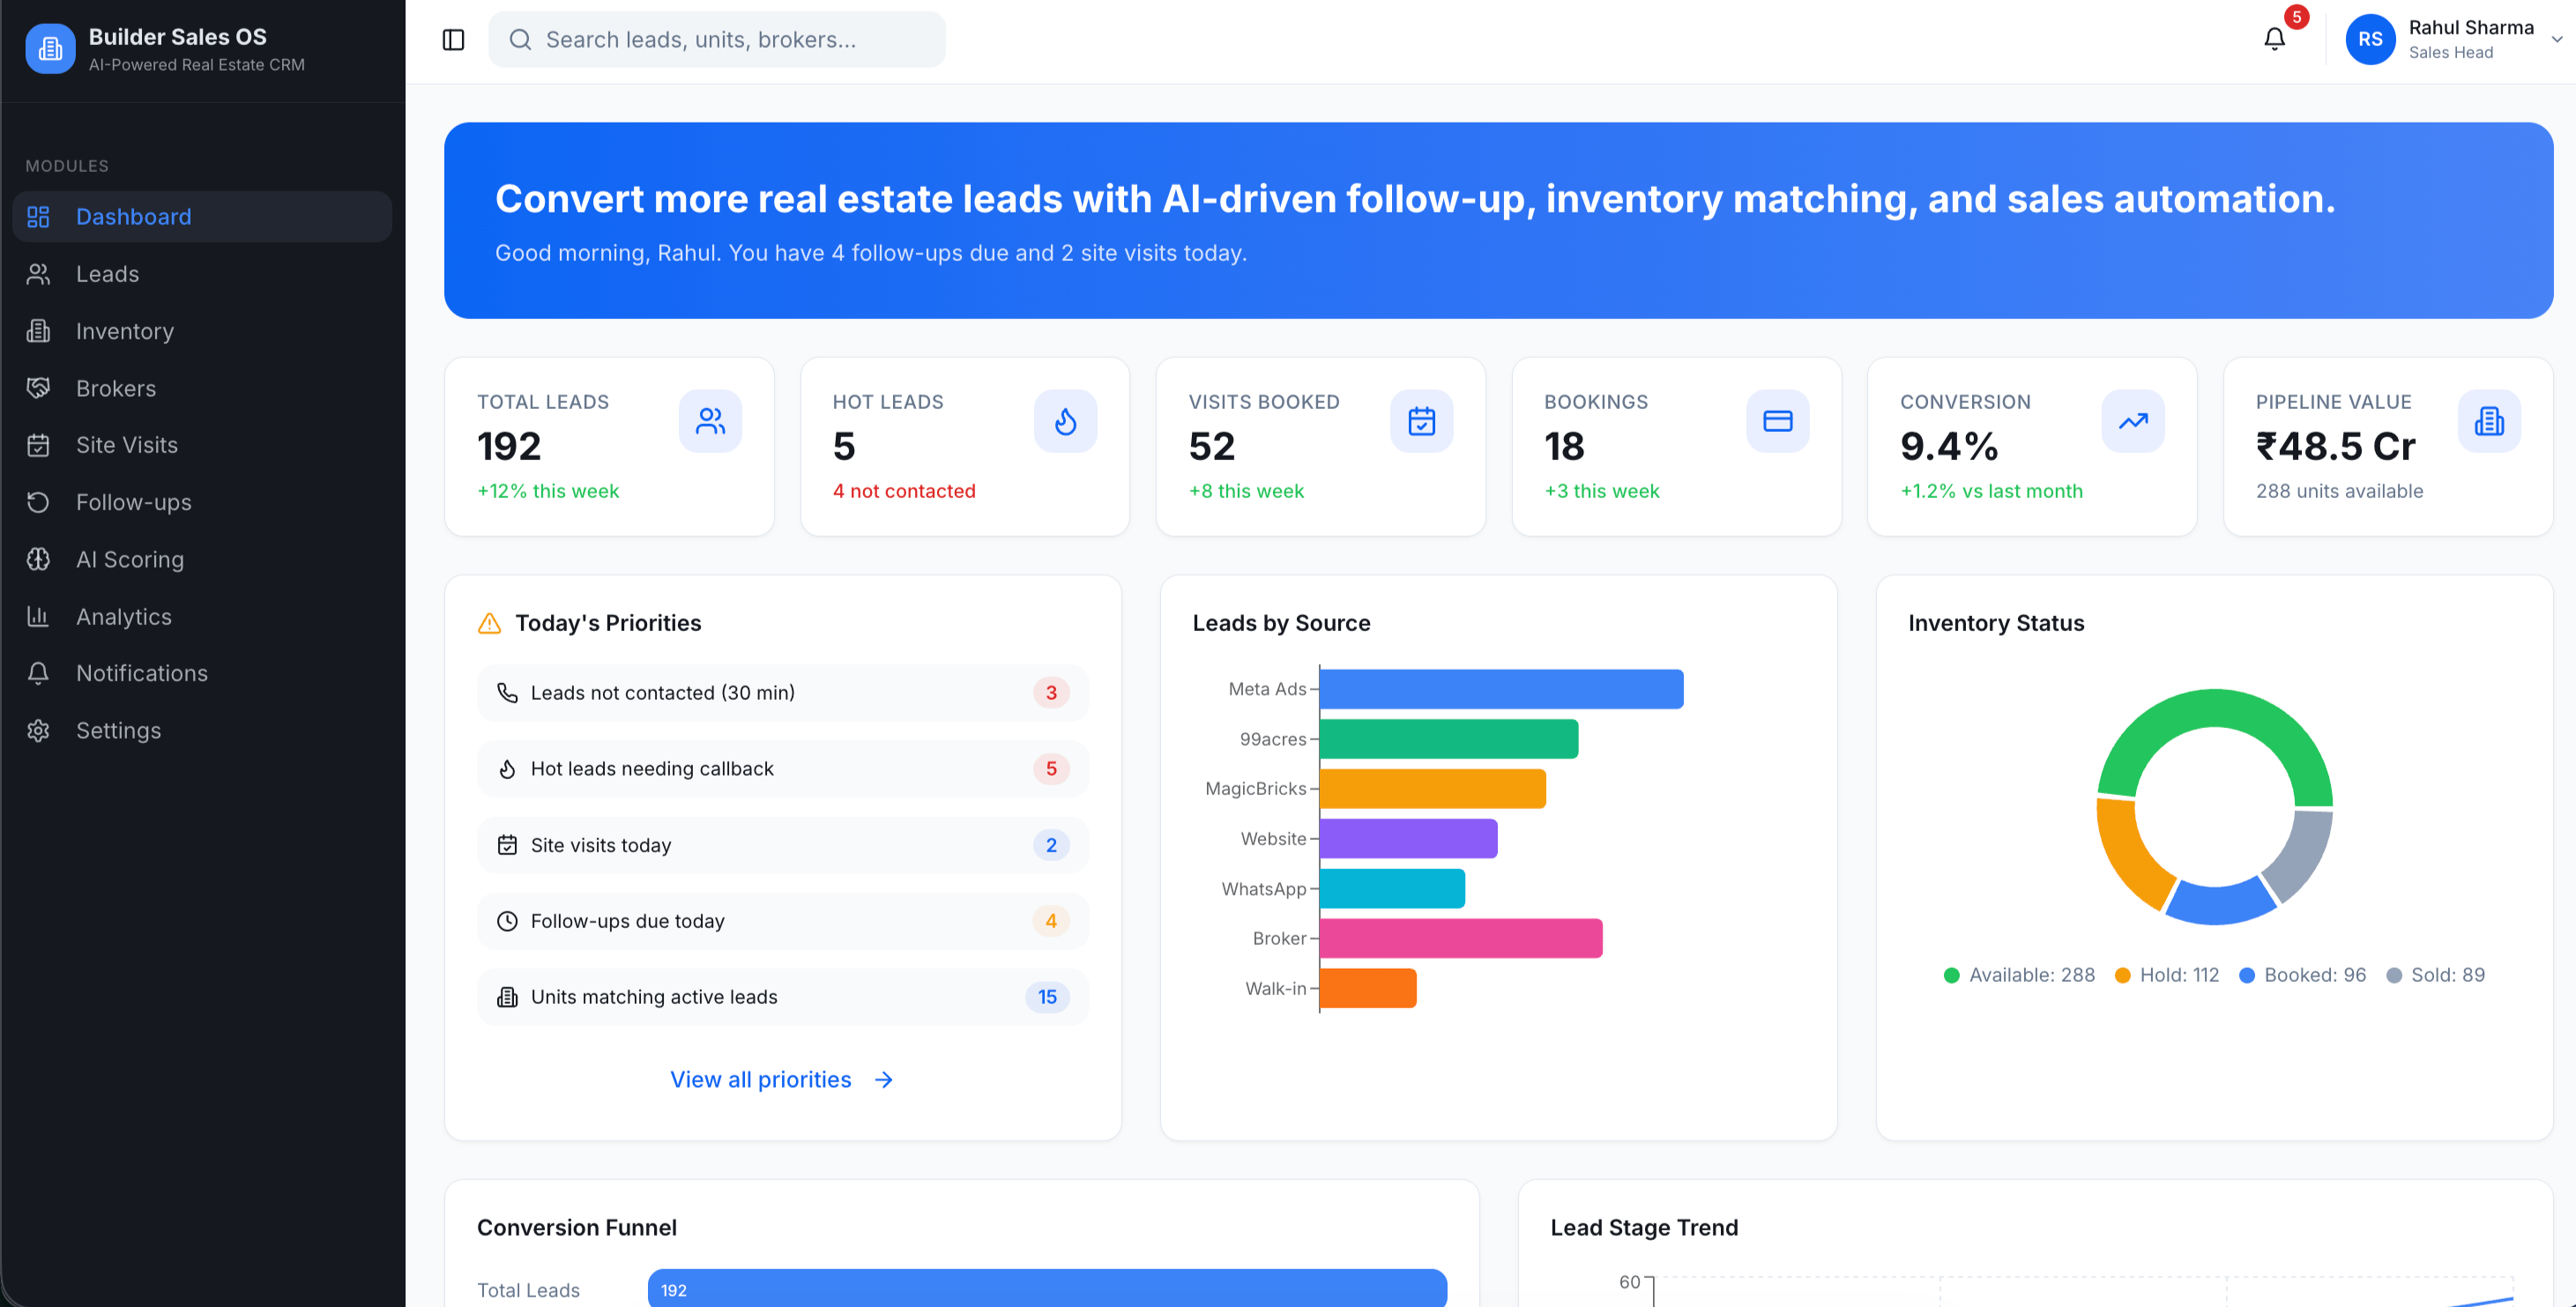
Builder Sales OS
AI-powered real estate CRM concept that centralizes lead management, inventory matching, site visits, follow-ups, broker performance, and sales analytics.
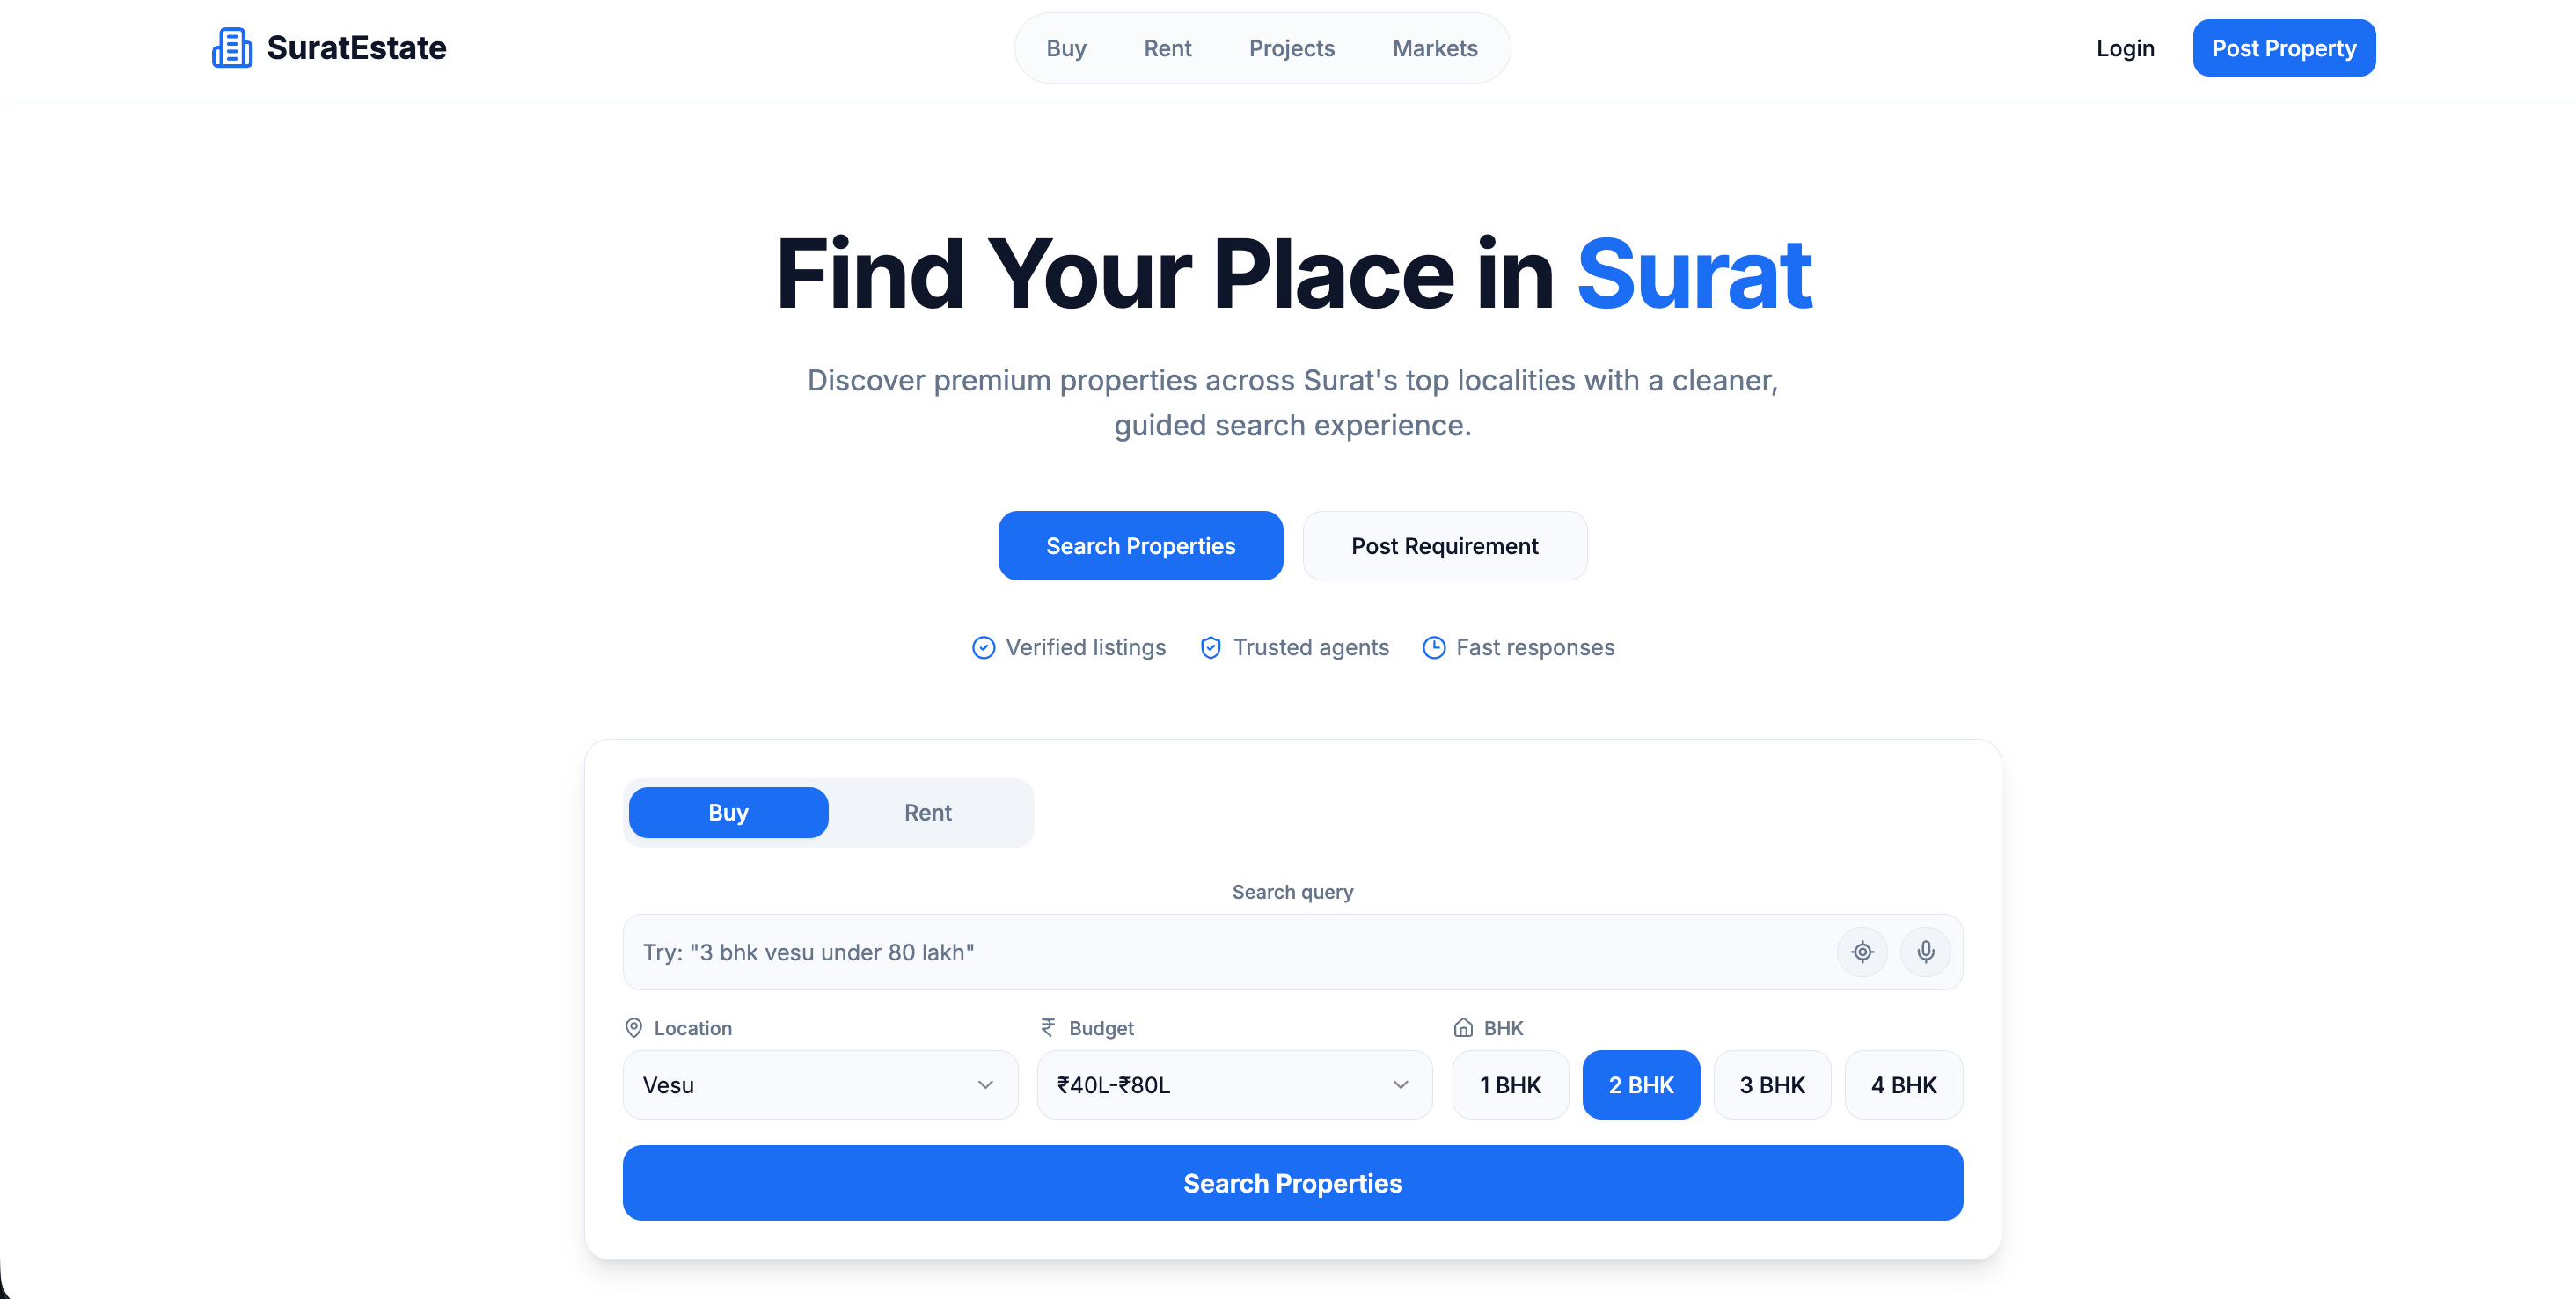
SuratEstate
Surat-focused property discovery demo with guided buy/rent search, locality exploration, project discovery, featured listings, commercial markets, and decision tools.
Need a Similar System?
I design AI-native platforms, operational software, internal tools, workflow systems, and business applications.